
Drahomira Herrmannova, Ramakrishnan Kannan, Seung-HwanLim, and Thomas E. Potok
Oak Ridge National Laboratory
GitHub Page: https://github.com/ORNL/smcdc-2021-covid-kg
The scientific literature is expanding at incredible rates, which were recently estimated to be in the millions of new articles per year. Extracting information from such vast stores of knowledge is an urgent need, as exemplified by the recent open release of materials relevant to the current SARS-CoV-2 pandemic. In this context, this challenge seeks to develop algorithms for the analysis and mining of knowledge graphs. The main task in this challenge is to leverage a graph of biomedical concepts related to COVID-19 and the relations between them to try to discover novel, plausible relations between concepts. For this challenge, the participants will be provided with a graph dataset of biomedical concepts and relations between them extracted from scientific literature, along with all-pairs shortest path information between the concepts in the graph. They will be asked to analyze the data and use it to predict which concepts will form direct novel relations in the future. In addition, they will be asked to rank the predicted links according to the predicted importance of each relation.
Introduction
The scientific literature is expanding at incredible rates, which were recently estimated to be in the millions of new articles per year [3]. Extracting information from such vast stores of knowledge is an urgent need, as exemplified by the recent open release of materials relevant to the current SARS-CoV-2 pandemic [4]. Given that the volume of information is easily beyond the capacity of any one person, analysts have been strongly motivated to develop automated knowledge-mining methods and extraction tools [10, 8, 1].
In this context, this challenge seeks to develop algorithms for the analysis and mining of knowledge graphs. More specifically, this challenge is based on the process of literature-based discovery [6]. It has been shown that previously unknown relationships exist in the scientific literature that can be uncovered by finding concepts that link disconnected entities [6, 7, 9]. This process, calledSwanson Linking, is based on the discovery of hidden relations between conceptsA and C via intermediate B-terms: if there is no known direct relation A-C, but there are published relations A-B and B-C one can hypothesize that there is a plausible, novel, yet unpublished indirect relation A-C. In this case the B-terms take the role of bridging concepts. For instance, in 1986, Swanson applied this concept to propose a connection between dietary fish oil (A) and Raynaud’s disease (C) through high blood viscosity (B), which fish oil reduces [5]. This connection was validated in a clinical trial three years later.
Tasks and Data
The main task in this challenge is to leverage a graph of biomedical concepts related to COVID-19 and the relations between them to try to discover novel, plausible relations between concepts.
Data
The participants will be provided with the following data:
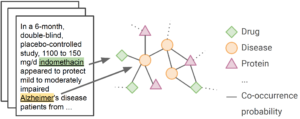
Figure 1: Depiction of the challenge data.
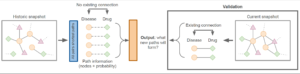
Figure 2: Depiction of the challenge task.
The participants will be asked to use the graph and the all-pairs shortest paths information provided (training data) to predict which concepts will forma direct connection in the future (validation data). This process is depicted inFigure 2.
A detailed description of the dataset including the format and the process used to produce the dataset is provided in [2]. The dataset that will be provided for this competition represents an updated version of the dataset4 described in [2]. The updated version includes concepts that were extracted from articles published since the first release of the dataset.
The participants are allowed to leverage external data, particularly data from PubMed and Semantic MEDLINE that are not included in the provided dataset.
Tasks
References
 Download
 Slack Channel
 Challenge Contact
 Dataset