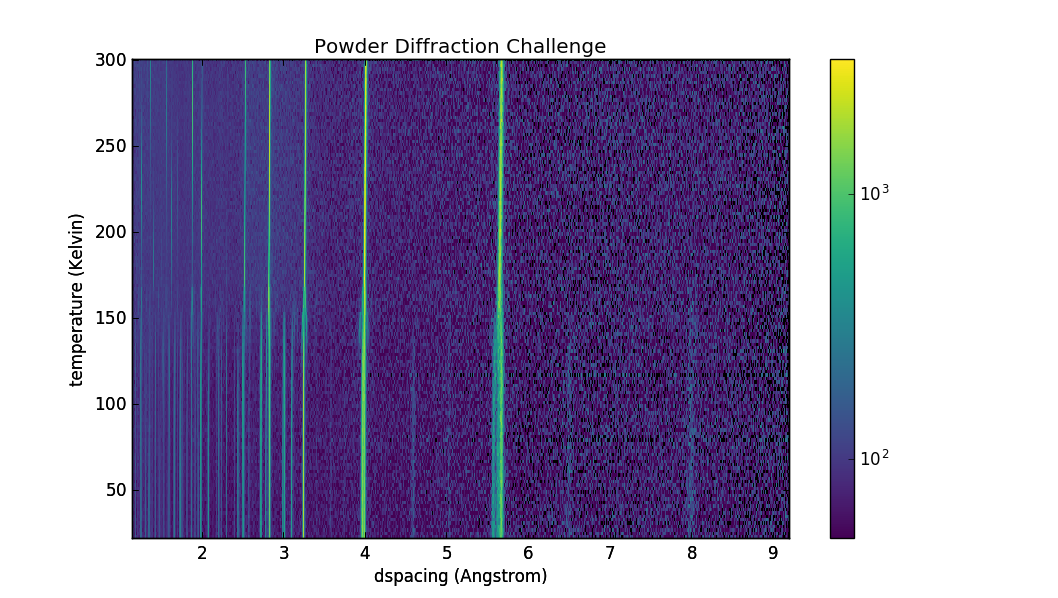
Neutron powder diffraction is a powerful way to examine the atomic structure of technologically interesting materials. The particular material from this data set is a candidate for solar cells . Nevertheless, the same methods are used in battery materials, catalysts, etc. A single data set has 2 dimensions: Intensity(I) and d spacing (d). The d spacing is a characteristic structural scale in the system. If there is a large I at a given d, that means there are at least two atoms spaced at that distance in the system. If I is at the background it means there is nothing with that d spacing in the material.
Often functional behavior is related to a structural change with an external parameter like temperature. This structural change show up as change in the existence, position or width of the peaks. The provided data set is a collection of I vs d curves at multiple temperatures. So the data set is 3 dimensional I(d,T). The data is in an HDF5 file.
H5py is a useful set of libraries for accessing HDF5 files from python. If you are not familiar with hdf5 and want to browse the data structure want to browse the data structure we recommend hdfview or nexpy. However, the developed algorithms should run independently of these codes.
Challenge
Given the aforementioned data set, here are the challenge questions
- Provide an algorithm that given the data set as an input, provides the temperature of the structural transition.
- Provide an algorithm that gives the integrated area under, the center of intensity, and a characteristic width for the peak that is between 3.2 and 3.3 Å in d spacing as a function of temperature.
- Provide an algorithm that gives the integrated area under, the center of intensity, and a characteristic width for all peaks at a given Temperature.
- Given adjacent temperatures, provide an algorithm that indicates if a phase transition occurred between the two temperatures, a list of centers, widths, and intensities for all peaks in the data set that are at least 1.5x above background in under 5 seconds
Our preference is for the algorithms to be implemented in Python with use of the numpy library, other necessary libraries are welcome. If the participant prefers a compiled code, C/C++, is our preferred solution with the output being in a python or numpy data structure.