
Jean Bilheux, Hassina Bilheux, Garrett Granroth, and Thomas Proffen, Rick Riedel, Peter Peterson
Oak Ridge National Laboratory
AbstractNeutron radiography (nR) is a technique that is used for a broad range of applications such as energy materials, engineering, geomaterials (rocks, plants and soil), biology, and archeology. A sample placed in front of a 2D detector is illuminated with neutrons and a shadowgraph is measured based on the neutrons that transmitted through the sample. Like most imaging techniques, domain applications require increased spatial resolution beyond what is currently and routinely achievable today. New detector technologies offer the possibility to increase spatial resolution by reducing the effective pixel size. More specifically, advanced analysis is used to precisely locate the position of impact of a detected neutron (also called neutron event). The challenge here is to develop a novel method to better resolve the neutron position for the Timepix3 detector, hence increasing the spatial resolution of the radiograph. Specifically, the goal of this challenge it to resolve features that are smaller than 25-50 µm.
Neutron Radiography Principle
Neutron radiography is a technique that measures neutrons transmitted through an object placed in front of a two-dimensional pixelated detector. The radiograph is often called the transmission radiograph as it corresponds to the ratio of the transmitted beam, I, over the incident beam, I0. The Lambert-Beer law defines the transmission, T, as
T = I/I0 = e-µx
where µ is the linear attenuation coefficient and x is the object thickness.
Neutron radiography is complementary to X-ray radiography. Since neutrons have no charge, they can deeply penetrate into materials, such as steel, which are often difficult to access with X-rays. Moreover, neutrons are sensitive to light elements such as hydrogen and lithium. Examples of domain applications that frequently utilize neutron radiography are the measurements of lithium distribution in batteries used for electronics such as a cellphone, water uptake in plant roots, hydrocarbons in vehicle particulate filters, inner structures of archeological materials or planetary objects such as meteorites.
Since neutrons have no charge, their measurement is non trivial. Most detection methods involve their capture and conversion into a charged particle that can then be detected. In the case of this challenge, the pixelated detector is called a multichannel plate (MCP) timepix3 detector. Neutrons are first converted absorbed in the 10B in the MCP and subsequently a charged alpha particle is released, which creates an avalanche of electrons. The Timepix3 chip is reading the electron signal. More specifically, advanced analysis is used to precisely locate the position of impact of a neutron (also called neutron event) from the avalanche of electrons.
Because spatial resolution is key in measuring small features such as defects in objects, there is a continuous pursuit to reach higher spatial resolution. The resolution of a detector is defined by its ability to measure fine details in a radiograph. Spatial resolution can be measured using a resolution mask called a SIEMENS star. A SIEMENS star is a flat object that is composed of concentric bright lines, through which most neutrons transmit, surrounded by an opaque background with little to no neutron transmission. The lines become more separated as they move away from the center, as illustrated in Figure 1. At the center of the star, the lines are spaced at 25µm and at the outside the spacing is 500µm. Varying continuously from the center outwards.
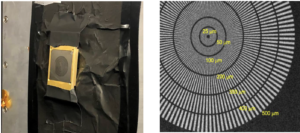
Figure 1. (left) photograph of the SIEMENS star affixed to the MCP Timepix 3 detector, (right) Neutron radiograph of the SIEMENS star measured with a previous detector
Timepix 3 detector
The novel generation of nR detector, called the Timepix 3 detector, presents a new and exciting opportunity to increase spatial resolution beyond today’s ~ 25-50 µm limit. These detectors run in event mode, i.e., the position (x and y axes), the time, and time-over-threshold (TOT) of each neutron event are recorded in a data file. The 3rd generation of these detectors was, for the first time, tested at the Spallation Neutron Source, and the data it produced are available for this challenge. The rate of acquisition can reach 150 MB/s. The large size of the data arises from the fact that each neutron event causes an avalanche of electronic events or in other words lots of electronic events per neutron. These electronic events occur around where the neutron interacted with the detector so we call each one a cluster of events. In practice, each cluster is analyzed to determine its centroid which determines the position of the neutron event. The maximum spatial resolution of the nR detector is directly dependent upon the accuracy of the method used to determine the centroid of each cluster.
Cluster Analysis
When a neutron is captured by the detector, a series of chain events, or hits, takes place. Each neutron event can create up to 60 or more of these hits. All hits produced by the same initial neutron capture is known as a cluster.
The main properties of hits from a given cluster is the fact that occur at approximately the same time and the same place in the detector. The time window and the location window are generally considered free variables in the analysis of the pixel hits. But one must keep in mind that two or more clusters may be recorded at the same time if two neutron captures are very close in time and even in space as well. Other parameters that can be used to associate such or such hit to a particular cluster are the total number of hits in a cluster, the total energy of the cluster (given by the sum of the time over threshold (TOT) values for each pixel hit), and the shape of the cluster (typically elongation and whether missing pixels in the geometry are allowed). The information we are seeking is the position of the incident neutron, which can be determined by either centroiding (center of mass of the discretized TOT function as calculated using the TOT values for each pixel hit) or using other fitting algorithms. It will be up to the challenge candidates to determine the optimum algorithm to use. By optimum we mean the algorithm that will allow to reach the highest spatial resolution.
Working with the data stream
As mentioned above, pixel hits associated with a cluster do not necessarily come in order. For this reason, the algorithm must keep a log of pixel hits that start to form a cluster and when a new pixel hit is seen, the software must decide if it belongs to a currently forming cluster or if one must start a new cluster.
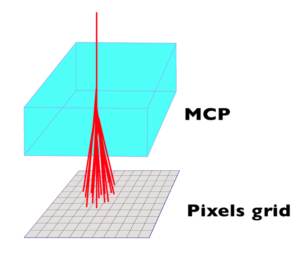
Figure 2: Incident neutron (red) creates multiple hits when going through the multi-channel plate (MCP) and creates a cluster of hits registered over several pixels.
Challenges
The goal of this challenge is to be able to resolve the lines as close to the center of the circle as possible (see yellow arrow in Figure 1-right). With the ultimate goal to increase the spatial resolution of the new Timepix3 detector, the following sub-challenges need to be addressed:
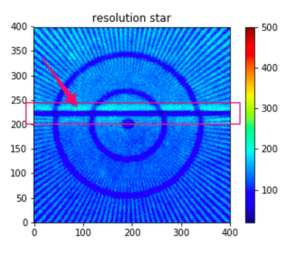
Figure 3. horizontal gap between two chips is highlighted here. Full detector contains an array of 4 (2×2) chips.
Challenge Data Format
File name: frames_000018.h5
File format: HDF5
data format: Each detection event is made up of 4 attributes – x, y, TOT and time. x and y are in pixel, time is in nanoseconds. TOT is a weighting of how strong the event is. x, y and TOT are int16 and time is int64.
Python code to read HDF (works with both python-2 and python-3)
>>> import h5py
>>> f = h5py.File(‘hdf_file_name’, ‘r’)
>>> print(f.keys()) # to get list of keys, ex [‘col_names’, ‘data’]
>>> col_names = f[‘col_names’][:]
>>> print(col_names)
Array[‘x’, ‘y’, ….]
>>> data = f[‘data’][:]
>>> data
Array[[1,2,3,…..]]
 Download
 Slack Channel
 Challenge Contact
 Dataset