
Anne Berres, Srinath Ravulaparthy, Kuldeep Kurte, Jibonananda (Jibo) Sanyal
Computational Urban Sciences Group, Computational Sciences and Engineering Division
Oak Ridge National Laboratory
Problem Background & Context
Traffic congestion on roadways results in increased travel times, reduced speeds, and increased queueing of vehicles. Congestion typically occurs when demand exceeds capacity on roadways and at intersections. As cities begin addressing traffic congestion, a plethora of solutions are being implemented, out of which Intelligent Traffic Cameras (ITC) are gaining popularity. ITC systems are aimed at traffic monitoring and incident detection (e.g., accidents) to ultimately ensure safe and efficient movement of vehicles through the transportation system in a given region. These tools are extremely important for traffic planners especially within the context of smart cities, emerging mobility services, and connected and autonomous vehicles (CAVs).
To this end, the city of Chattanooga has deployed multiple cameras along major corridors in the region. The vendor for these cameras is GridSmart Technologies. The cameras monitor traffic at various intersections on a minute-by-minute basis. The typical data recorded at the intersection includes but is not limited to vehicular movements (e.g., through traffic, left-turn and right turn movements) and average speed of oncoming traffic.
Data Description and Usage
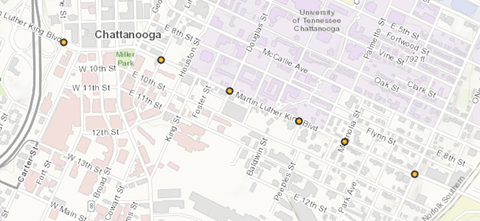
For this Data Challenge, we are providing traffic data for Martin Luther King Boulevard in Chattanooga, TN. This corridor is adjacent the University of Tennessee Chattanooga and extends into the downtown area. The Chattanooga Department of Transportation has placed GridSmart sensors at six intersections along the corridor. These sensors collect real-time information about all vehicles that cross the intersection, derived from a fisheye camera video stream (imagery is not included in this data challenge). The dataset spans January 20–27, 2019 (8 days). On Martin Luther King Jr. Day (January 21), a parade took place on this corridor.
The dataset comprises the following:
Participants are welcome to bring in additional (public) datasets and fuse it with the provided data to create meaningful insights.
Challenge Questions
a. Visualize the hourly variation of attributes across the corridor and intersections.
b. Interactive capability across the corridor (e.g., mapping capability).
c. These anomalies can vary from discontinuous traffic volumes along the corridor to large discrepancies in recorded speed profiles.
d. Congestion can be defined according to travel time, speed, or demand.
e. Commute times typically remain stable during weekdays when compared with weekends.
f. Traffic management is typically carried out at the corridor level (i.e., made up of multiple intersections).
g. The system mostly follows conservation principles wherein traffic entering and exiting the system can be tracked. This is true even in predictive models.
h. Model validation can be performed using several techniques (e.g., split the data into training and test data).
i. Predictive models are never deterministic. What level of uncertainty is involved in these forecasts?
Team Description and Data Challenge Overview
The Computational Urban Sciences Group led by Jibonanda (Jibo) Sanyal is working with Anne Berres, Kuldeep Kurte, and Srinath Ravulaparthy to apply cutting-edge computational modeling and simulation techniques to solve issues in the urban sciences. Their research is at the nexus of transportation planning and operations, spatial sciences, energy sciences, statistics, and high-performance computing (HPC). This current collaboration is based on the US Department of Energy-funded project on Real-Time Data & Simulation for Optimizing Regional Mobility. The goal of this project is to evaluate and improve regional traffic congestion by developing and applying a cyber–physical control system strategy for real-time and predictive control of traffic patterns. By implementing this system in a modest-sized urban/suburban region, the project team expects to achieve a 20% energy savings at the regional level by delivering smart and efficient mobility.
This dataset generated as part of this project is aimed at developing a cyber–physical system to enable energy-efficient mobility systems from early-stage HPC-based research and development through demonstrations to commercialize the optimization of mobility, energy efficiency, and productivity in a regional traffic domain. The researchers are excited to share this dataset, as this is first-of-its kind data coming directly from sensors in the city of Chattanooga, where intelligent traffic management planning is key to addressing safe and efficient movement of vehicles through the system. Ultimately, benefits from connected and smart sensors will come in the nearer term from accelerated intelligent infrastructure impacts on the operation and movement of conventional vehicles. The group hopes that participants will excel and contribute in terms of data and visualization analytics, algorithm development, and deployment to this cross-disciplinary data challenge.