
Data description for Automating signal extraction – scientist vs computer
Scattering Data from solid materials can be modeled as a sum of oscillatory functions where the frequency of these oscillations are determined by atomic spacings in systems. Determining the atomic spacings allows the researcher to understand the structure of the material. This challenge examines two forms of SiO2 one that is amorphous and another that is crystalline. The data 𝑆𝑄 is acquired in reciprocal space 𝑄 on a grid and is limited in statistical accuracy. The structure described in real space 𝑟 and is a priory unknown. The two descriptions have a discrete Fourier sine transformation relationship:
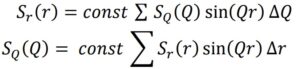
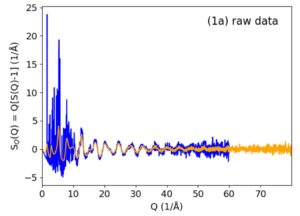
In these equations r and Q have a similar relationship as frequency and time traditional signal processing. Since components of the signal possess different sharpness in real space, an experienced operator can minimize the noise transported by subdividing the signal into different ‘components’ composed of a range of Fourier frequencies, choosing for each just a much reciprocal space as needed to not degrade the resolution of the real space signal but more as not to transport noise unnecessarily. However, this is a somewhat subjective process – albeit guided by the physics of the material – and is not automated. The overarching goal is to extract as many (how many?) reciprocal space components as needed to capture the information that is contained in the scattering data. The specific challenge is how many of these high frequency components can be extracted given the noise and how far each should be
extended in reciprocal space.
Cristobalite: M. T. Dove, D. A. Keen, A. C. Hannon, I. P. Swainson Phys Chem Minerals (1997) 24: 311–317
Quartz glass: A. Wright Journal of Non-Crystalline Solids (1994), 179 84-115

The data provided for this challenge was measured using the Nanoscale-Ordered Materials Diffractometer (NOMAD) at the Spallation Neutron Source (SNS) at Oak Ridge National Laboratory. The data is stored in a hdf5 file following the NeXus standard and can be read with tools built for either.
While the NeXus format is self-describing, there is benefit to explaining some details. The data is stored
in 4 NXentries in the file. The NXentries that begin with “amorphous_SiO2” are for the amorphous data,
and the NXentries that begin with “crystalbolite_SiO2” are for the crystalline material. Solutions that were produced by the scientist are in the entries that end with “_byhand”. Each of the NXdata groups are the plottable data with the “signal”, “axes”, and (in the case of by-hand components) “auxiliary_signals” describing which fields should be used.
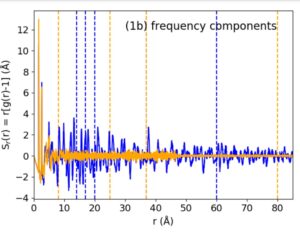
The by-hand component ranges are listed in a “component” attribute of the various signals. The filtered
Sr data is the Fourier transform of the combined components.
The data can be quickly viewed using tools such as Nexpy or HDFview. Most languages have libraries
that can work with HDF5 (eg. H5py for python) a partial list is provided at
https://manual.nexusformat.org/utilities.html
The data can be quickly viewed using tools such as Nexpy or HDFview.
https://neutrons.ornl.gov/nomad
https://www.hdfgroup.org/solutions/hdf5
https://www.nexusformat.org/
Dataset Download (DOI): https://doi.ccs.ornl.gov/ui/doi/381
Instructions for Data Download: https://smc-datachallenge.ornl.gov/wp-content/uploads/2022/05/Constellation_Downloading_Guide_v02.pdf