
EAGLE-I Outage Data 2014-2022
Team: Supriya Chinthavali, Aaron Myers, Sarah Tennille, Nils Stenvig, Matt Lee, Melissa Allen-Dumas
Overview: Restoring power after an outage event is a critical piece of response and recovery for those in the emergency response sector. When analyzing data on power outages, we seek to understand spatial and temporal patterns, restoration times, correlations with other relevant datasets, future outage predictions, expected outage behavior, and how we might fill in data gaps. Analysis at the county level is recommended when possible.
Source: The Environment for the Analysis of Geo Located Energy Information (EAGLE-ITM) is maintained at Oak Ridge National Laboratory (ORNL) for the Department of Energy (DOE). EAGLE-I is DOE’s operational and scalable data and information platform for real-time wide-area situational awareness of the energy sector, providing a centralized platform for monitoring power distribution outage for over 146 million customers; just over 92% coverage of US and Territories.
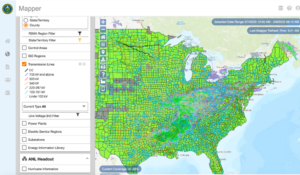
Figure 1: A screenshot of the EAGLE-I platform with current power outage numbers colored by county, HIFLD transmission lines, and NWS radar overlayed.
Dataset description: The provided dataset includes eight years of power outage information at the county level from 2014 to 2022 at 15-minute intervals collected by the EAGLE-I program at ORNL. This dataset has been collected from utility’s public outage maps using an ETL process. Note that the number of “customers” does not necessarily equate to the number of people affected, as a “customer” reported by a utility could be one meter, one building, etc. Also included is the coverage of each state for each year included in the dataset.
Challenge Questions:
Dataset Download (DOI):
EAGLE-I Umbrella DOI: https://doi.ccs.ornl.gov/ui/doi/436
2014 – 2022 DOI: https://doi.ccs.ornl.gov/ui/doi/435