
Russell B. Davidson†, Mark Coletti†, Mu Gao⋆, Jerry M. Parks†, Ada Sedova†§ † Oak Ridge National Laboratory, Oak Ridge, TN USA
⋆Georgia Institute of Technology, Atlanta, GA USA
§Corresponding Author and Data Liaison
The full set of proteins encoded by an organism’s genome — its proteome — represents a massive and complex dataset that is directly connected with grand challenge questions in bioinformatics, molecular biology, medicine, and many other fields [1]. Knowledge of the three-dimensional, atomic structure of a protein is often necessary in order to understand and modify the functions that the protein has within biological pathways; enzymatic activity, ligand or cofactor binding, and protein-protein interactions are all extremely difficult to rationalize in the absence of a protein structural model [2]. Due to massive sequencing efforts over the last three decades, many organisms’ proteomes have been sequenced and annotated; most of these results are readily available in databases for scientists to delve into. However, the three-dimensional structures of these proteins are often lacking due to the expense and challenge associated with the experimental methods necessary to obtain this information. For example, the human genome has been fully sequenced for nearly two decades yet only about 17% of the human proteome has an experimentally determined structure [3]. Developing a capability for computational protein structure prediction to fill in these large knowledge gaps with accurate models has been a grand challenge for over fifty years, and the focus of many scientific efforts.
This capability for protein structure prediction at near-experiment accuracy has recently been realized through the use of deep learning, advanced bioinformatics methods, and the full database of experimentally determined crystallographic protein structures, which has now grown to about 180,000 entries. Specifically, Google DeepMind’s AlphaFold method (version 2) achieved unprecedented accuracy in the biennial Critical Assessment of protein Structure Prediction (CASP14) challenge [3]. With this breakthrough comes the potential to generate large datasets of high accuracy protein structure predictions containing orders of magnitude more elements than are currently found in the existing crystallographic databases. Campaigns to generate sets of predicted structures for full proteomes and share them in public databases have already been initiated by AlphaFold with its AlphaFold Protein Structure Database.1 The current number of predicted structures, deposited just within the past year, is approaching 10 times more than the entire set of experimental structures produced over the past fifty years. With this new capability, structural biology has entered a big-data era.
Our group has also taken on this challenge, using the Summit supercomputer at the Oak Ridge Leadership Computing Facility to run AlphaFold at proteome-scale. We have generated protein structure sets for organisms relevant to the Department of Energy’s (DOE) Biological and Environmental Research Program (BER), most of which have not yet been treated by the AlphaFold database project [4]. Our aim is to use these structures to help with the annotation of proteins of unknown function, and to provide hypotheses for experimental testing to aid the BER mission.2 Here, we provide a full proteomic set of predicted structures from the Pseudodesulfovibrio mercurii genome. This organism, which is able to methylate elemental mercury, is important to BER’s efforts to understand and tackle heavy metal pollution in waterways [5].
1 https://alphafold.ebi.ac.uk/
2 https://www.energy.gov/science/ber/biological-and-environmental-research
A wealth of potential insights can be gleaned from the proteome-scale structural datasets, and uncovered information will drive further scientific inquiry not just for structural biology but also for bioengineering efforts, synthetic biology, and medical applications. Development of new data analysis tools, algorithms, and software that can parse, visualize, and digest this wealth of novel data is desperately needed. One avenue for analysis is comparing predicted protein structures to experimentally determined structures. There are several tools available for performing structural alignments between proteins [6–9]. With results from alignment analyses, we can begin to annotate predicted structures that match well to known proteins with metadata already available, such as biochemical classifications and important structural motifs. Alternatively, predicted structures that have no similarity with experimentally determined structures may represent novel protein folds or assemblies that have never been observed before. The identification of important atomic-level conformations, such as metal and cofactor binding sites, enzyme active sites, and channels for transport are another approach; a fascinating discovery was that AlphaFold was able to correctly model the atomic conformations around these bound molecules without explicit information about their presence [3]. New algorithms and programs for this type of analysis are needed, especially for large-scale screening; GPU-acceleration of such calculations would provide great benefits as well. The provided dataset of the Pseudodesulfovibrio mercurii proteome and alignment results provide a good testbed for the development of such data analysis tools. The challenge questions range in breadth and difficulty from parsing the structure prediction and alignment results to development of methods to search for interactions patterns and elucidate physical ensembles.
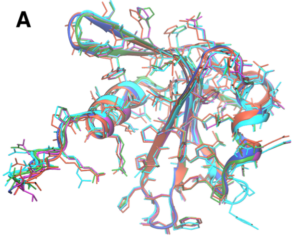
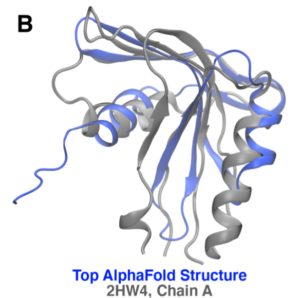
Figure 1: Prediction and alignment results for protein WP_010940344.1 from a different microbe, Desulfovibrio vulgaris. (A) AlphaFold models with an average pTMS of 0.826. (B) Alignment with top hit, 2HW4, a human phosphohistidine phosphatase. The two proteins only have 11.1% sequence identity but have a TM- score of 0.803.
A DOI that will allow you to obtain the data, will be provided soon for the data describe below. Check back for updates.
The number of proteins predicted for Pseudodesulfovibrio mercurii is 3,446, each of which have five predicted structures from an AlphaFold run, as well as structural alignment results using the TMscore-based structural alignment method within the APoc program [3, 6]. Specifically, AlphaFold outputs the atoms and coordinates of the protein model in human readable PDB files3 and quantitative prediction metrics in Python PICKLE files.4 The 5 models, an example of which is shown in Figure 1(A), have been ranked based on the predicted TM-score, a quantitative confidence metric output by AlphaFold that reports on protein model quality. The top ranked model has undergone a energy minimization calculation (OpenMM, ff99SB force field, 10 kcal mol−1 Å−2 force constants on all heavy atoms) to relax and remove any potential clashes in the atomic coordinates.
Structural alignment results are stored in two files for each protein; the top ranked model (as discussed above) is used for all alignment analyses. Both are compressed gzip files. The first file is the TMalign score results and contains the quantitative metrics for the top alignments between the predicted structure and experimental structures from the PDB70, a curated non-redundant database of about 80,000 experimental structures developed by the Söding lab¹ Each data point in this file is directly associated with one experimental structure; PDB ID and brief meta-data about the protein taken from the PDB70 file are reported alongside the quantitative metrics. For example, the aligmnent results for the WP_010940344.1 identified the 2HW4 structure (chain A) as having a strong structural homology even in the absence of a strong sequence identity; this alignment is shown in Figure 1(B). The second results file contains the raw results associated with each alignment reported in the score results file. Specifically, the translation and rotation arrays for each alignment are provided so that the structural alignment can be recreated. Additionally, residue-level scores are reported to quantify the closeness of the aligned residues between the predicted and experimental models.
1 http://wwwuser.gwdg.de/~compbiol/data/hhsuite/databases/hhsuite_dbs/ 3

Q1 – Identify known-knowns and known-unknowns. The supplied data contains two sets of results, AlphaFold structures and TMscore-based structural alignments of predicted structures against the PDB70 database; both sets have scalar values that describe the quality of prediction or alignment, respectively. Structures with low prediction confidence will not be considered for this challenge. But, high quality predicted structures may or may not have strong alignment results; both of these instances are important and interesting. For high-confidence structure predictions that have a strong match to an existing crystal structure, clues about protein function can be derived. Those with no good matches can indicate new protein assemblies or folds, and could even lead to discovery of novel protein functions. For each protein in the provided proteome, parse the AlphaFold and alignment results to identify and report on these two instances. In an automated pipeline, scrape together and store as many quantitative and qualitative data as possible so that we can query those results.
Q2 – Visualization is key. While wading through the scalar metrics and meta data within this dataset, don’t forget that proteins are 3-dimensional structures! It is always important to visualize the structures alongside any information about the protein. We would like for these datasets to become available to the public through a website where they can be visualized and browsed through. Develop or apply a web app for 3D visualization of predicted structures. Ideally, this app is flexible in a couple of ways. First, the protein should be colored or shaded based on a user-defined, per-residue metric, which could include the AlphaFold confidence scores (pLDDT and pTMS), or some other values. Second, enable a user to depict the structures of alignment pairs as defined in the alignment results, either side by side, or in an overlay.
Q3 – Search for local landmarks. As described above, AlphaFold has been found to have learned interaction patterns of molecules that bind to a protein; for example, a space or “pocket” type geometry may be observed in predicted structures where a metal atom or other bound ligand may be found. Being able to describe and search for these types of patterns in large struc- tural databases can provide a wealth of new information about proteins. Homologous pockets or residue-residue interaction patterns are seen across a broad range of proteins and play important roles in a protein’s function. What features and metrics can be used to define, classify, and search for three-dimensional interaction patterns across a range of structures? For searching through hundreds of thousands of structures, each with a complex set of atomic interaction clusters, paral- lelization and GPU acceleration will be important. Bonus points are earned if GPUs and/or parallel methods are used to perform this analysis. An example of an interaction pattern calculation ported to GPUs for fast screening of bound ligands was developed for COVID research [10]; however, this feature includes small molecule ligand atoms (which will not be found in our predicted structures) and does not include radial positions of atoms.
Q4 – One is good. More is better. Statistical Mechanics postulates that, in order to explain the macroscopic behaviors of a microscopic system, we need to first appreciate the large number of microscopic entities and the available states that they can sample. Proteins are the epitome of mi- croscopic systems and are known to have complex dynamics and conformational states [11]. Five structures of a protein, as calculated by AlphaFold, goes a long way when trying to understand a protein’s function but provides a very limited perspective on the large number — the statistical en- semble — that best describes the protein’s biochemistry. Describing the protein’s conformational space with multiple, physically relevant structures is a more appropriate representation. Can we use AlphaFold models as spawn points for methods to obtain more structures of the protein? How can we ensure that new models are pulled from physically relevant ensembles? Utilize any and all tools at your disposal for this challenge, but please report on the advantages and disadvantages for the methods used.